
The latest Powerball jackpot seems to be making everyone a little crazy and/or stupid (myself included), but sometimes you just gotta call people out on it when they take the “stupid” part too far.
Today, one of my Facebook friends shared a very stupid picture. I’m not calling the friend who shared the picture stupid; I’m calling the picture itself stupid, for multiple reasons.
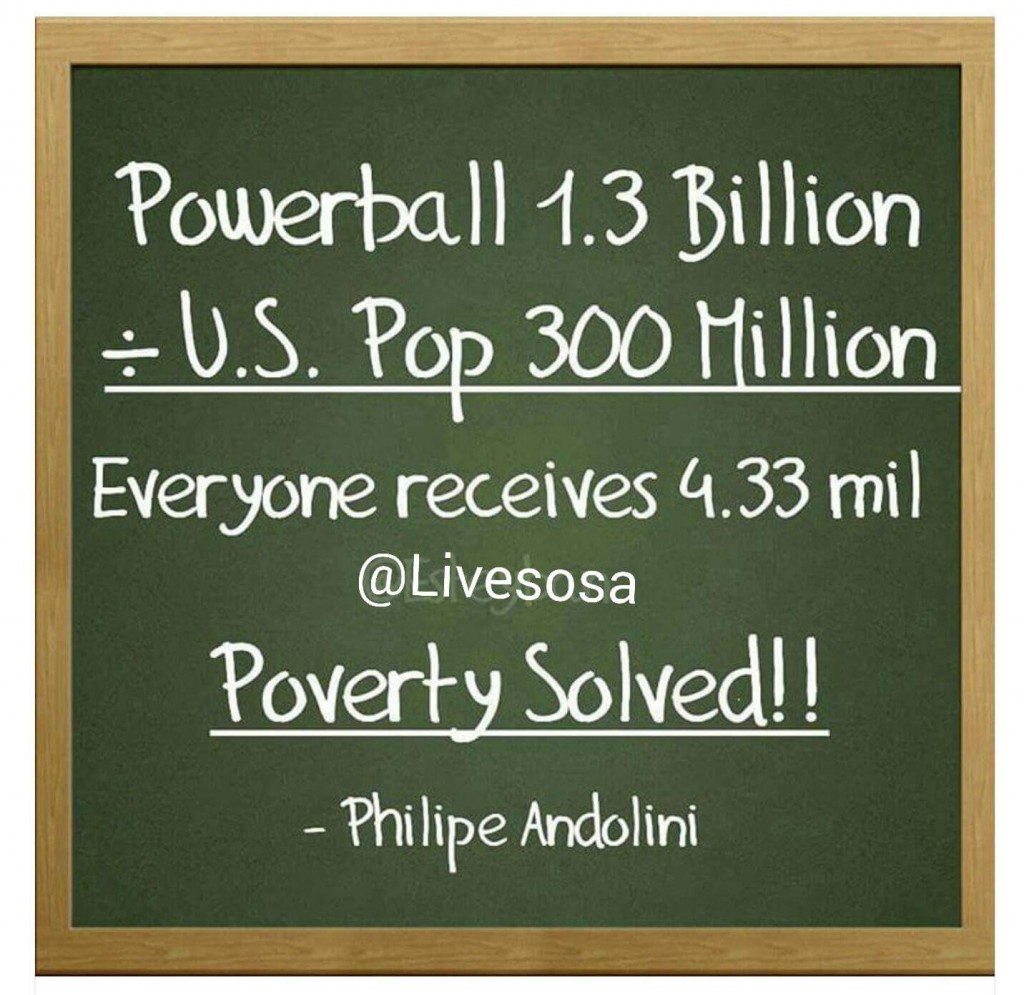
There are several issues with this:
- There’s a very simple math error; $1.3 billion divided by 300 million people is actually $4.33, not $4.33 million. (EDIT: It occured to me that the person who made this might have used the archaic British English definition of “billion”, which was one million million, or one trillion in American English. However, even if we use this definition — which isn’t common today — we end up with $4,333.33, not $4.33 million.)
- $1.3 billion is an annuity payout. It’s paid out in 30 equal installments over the course of the next 29 years. Spread out over 300 million people, that actually comes out to about $0.14 per person, per year.
- This fails to account for taxes that would be withheld.
The second point actually makes a good case for taking the lump sum option — as of the time of this writing, the cash payout was estimated at $806 million, which comes out to about $2.69 per person — still not $4.33 million (or even $4.33), but now we’re starting to get a little more realistic.
Even at $2.69, we’re still not accounting for tax withholdings. I don’t have the patience to go and figure out how much would be taken out of a Powerball jackpot for taxes; fortunately, other people have done that work for me. It’s going to depend on what state you live in — you’re going to be much better off if you live in California, Delaware, Florida, New Hampshire, Pennsylvania, Puerto Rico, South Dakota, Tennessee, Texas, Washington, or Wyoming — but for sake of argument, we’ll take my home state, which seems to have a 5% tax on lottery winnings. If I took the lump sum option here, I’d get $564.2 million after taxes, which works out to $1.88 per person.
Even this number is slightly off, because 300 million people is a pretty bad rounding of the US population; according to the US Census Bureau’s estimates, the current population is closer to 322.8 million people. (Where did those other 22.8 million people go, random internet person?? It’s like the Holocaust all over again…) Using this figure, we get closer to the neighborhood of $1.75 per person.
Now, let’s face reality: this would never happen. In a best-case scenario, you would take your winning ticket into your state’s lottery office and tell them “I want this jackpot paid out to everyone in the United States.” There is precedent for splitting jackpots among multiple winners (and my state’s lottery office confirmed that there’s no upper limit on the number of people that can split a jackpot), but the logistical nightmare caused by splitting it among 322 million people would most likely be enough for them to tell you “no” on the spot. In a next-best-case scenario, you would turn the money over to the federal government and ask them to do the same; but without an act of Congress, they’re unlikely to oblige. This means you’re left to do this on your own, and the likelihood of tracking down the home address of every single person in the United States is next to nil, even in today’s world. And, even if you did, you’re going to have to add in administrative costs for paying out to every single person — you’re likely going to pay almost $84 million alone just in postage to mail a check out to everyone.
Lastly, we have to ask the question — what good would it do to even mail $4.33 to everyone in the US? $4.33 doesn’t go far in today’s America. For most people, this might be a couple gallons of gas or a cheap meal at McDonald’s. The benefits of spreading the wealth around in this manner just aren’t there. (This is not to say that you couldn’t take your Powerball winnings and put them towards a good cause — but there are better ways to do it than by splitting it up and sending everyone a check.)
Now then — this post actually provoked a rather interesting thought. What if you took the annuity option? Would you split it up between everyone who was alive at the time you got the first payment? Or would you take each annual payment and split it between everyone who was alive in the US at the time? For the sake of this argument, let’s ignore administrative costs — let’s assume everyone signs up for direct deposit and it costs us a pittance to actually do so (split up, of course, over 30 equal installments of 1/30th of a pittance). Let’s also assume that we don’t have the Fed’s cooperation here — we’re going to be stuck paying taxes on the initial amount, and we’ll divvy up the rest to everyone after taxes are paid.
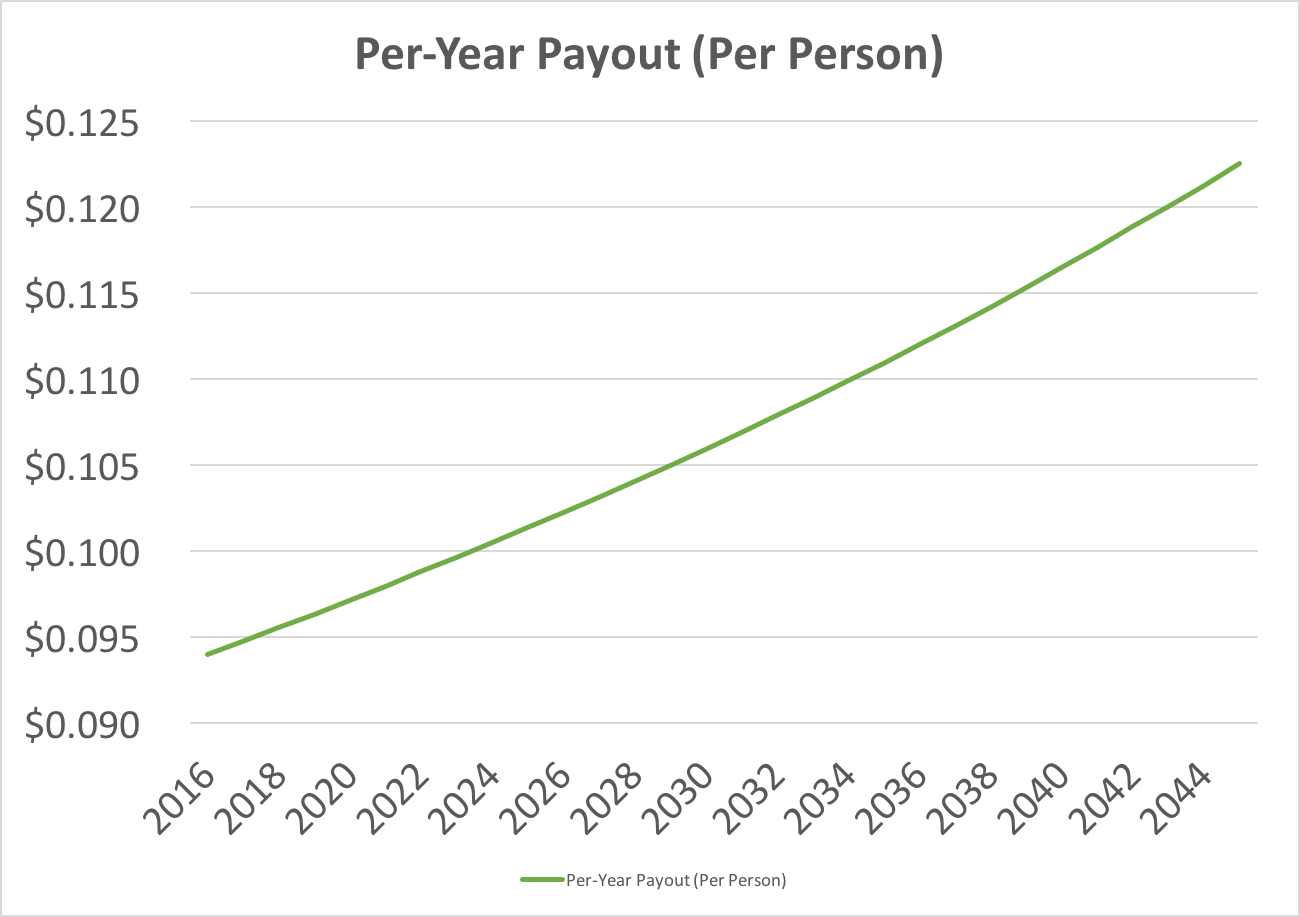
The first option actually works out better for the people who are alive at the time of the first payout, because the truth is that not all of them will live to see all 30 payouts (or even the second payout). The US Census Bureau has the death rate (as of 2015) pegged at 8.2 per 1,000 people per year; this means that, of our 322.8 million people, only about 320.2 million of them will live to see 2017’s payout. After taxes in my home state, each year’s payout is going to be $30⅓ million. This means that the first year’s payout is going to be a whopping $0.094 per person; the second year’s payout will fall just shy of $0.095 per person. The good news is that the death rate is projected to increase over time: by 2050 (just a few years after our experiment is over), it’ll top out at 10.3 per thousand people per year. By the time of the last payout, 75 million of you will be dead; those who are left will get about $0.122 each. Here’s how the math works out:
| Year | Starting Population | Payout (Per Person) | Death Rate (Per 1,000) | Ending Population |
|---|---|---|---|---|
| 2016 | 322,814,965 | $0.094 | 8.22 | 320,161,426 |
| 2017 | 320,161,426 | $0.095 | 8.24 | 317,523,296 |
| 2018 | 317,523,296 | $0.096 | 8.26 | 314,900,554 |
| 2019 | 314,900,554 | $0.096 | 8.28 | 312,293,177 |
| 2020 | 312,293,177 | $0.097 | 8.3 | 309,701,144 |
| 2021 | 309,701,144 | $0.098 | 8.37 | 307,108,945 |
| 2022 | 307,108,945 | $0.099 | 8.44 | 304,516,946 |
| 2023 | 304,516,946 | $0.100 | 8.51 | 301,925,507 |
| 2024 | 301,925,507 | $0.100 | 8.58 | 299,334,986 |
| 2025 | 299,334,986 | $0.101 | 8.65 | 296,745,738 |
| 2026 | 296,745,738 | $0.102 | 8.72 | 294,158,115 |
| 2027 | 294,158,115 | $0.103 | 8.79 | 291,572,465 |
| 2028 | 291,572,465 | $0.104 | 8.86 | 288,989,133 |
| 2029 | 288,989,133 | $0.105 | 8.93 | 286,408,460 |
| 2030 | 286,408,460 | $0.106 | 9 | 283,830,784 |
| 2031 | 283,830,784 | $0.107 | 9.1 | 281,247,924 |
| 2032 | 281,247,924 | $0.108 | 9.2 | 278,660,443 |
| 2033 | 278,660,443 | $0.109 | 9.3 | 276,068,901 |
| 2034 | 276,068,901 | $0.110 | 9.4 | 273,473,853 |
| 2035 | 273,473,853 | $0.111 | 9.5 | 270,875,851 |
| 2036 | 270,875,851 | $0.112 | 9.6 | 268,275,443 |
| 2037 | 268,275,443 | $0.113 | 9.7 | 265,673,171 |
| 2038 | 265,673,171 | $0.114 | 9.8 | 263,069,574 |
| 2039 | 263,069,574 | $0.115 | 9.9 | 260,465,185 |
| 2040 | 260,465,185 | $0.116 | 10 | 257,860,533 |
| 2041 | 257,860,533 | $0.118 | 10.03 | 255,274,192 |
| 2042 | 255,274,192 | $0.119 | 10.06 | 252,706,134 |
| 2043 | 252,706,134 | $0.120 | 10.09 | 250,156,329 |
| 2044 | 250,156,329 | $0.121 | 10.12 | 247,624,747 |
| 2045 | 247,624,747 | $0.122 | 10.15 | 245,111,356 |
Now, keep in mind — my math isn’t perfect. The Census’s death rates are only calculated at 10-year intervals starting in 2020 (except that they also did one for 2015), and I just did a simple linear interpolation of the death rate for the years in between. If someone else can come up with a better model, please send it my way.
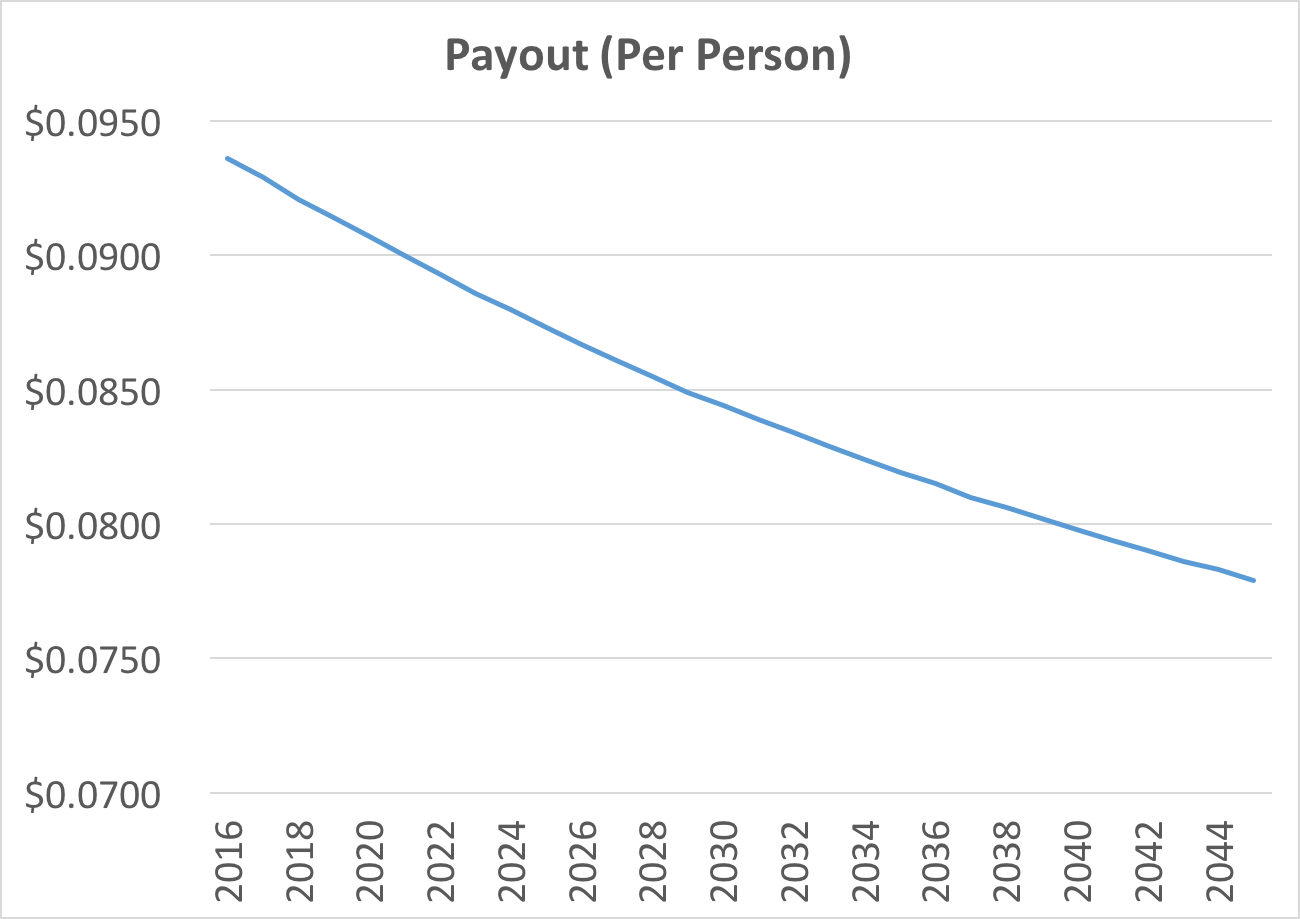
Figuring out the second option is easier, because the US Census Bureau has already done most of the work for me. They’ve put together projections showing what the population of the US will be each year, through 2060, so I don’t have to bother with birth rates/death rates and trying to figure out what the population is going to be each year. If we’re just going to take each year’s annuity and split it between everyone that’s alive in the US at that time, the first year’s payout will be the biggest — $0.094. The second year’s payout will still be around $0.094, but it’ll slowly decline, and by year 29, you’ll only be getting $0.078:
| Year | Starting Population | Payout (Per Person) |
|---|---|---|
| 2016 | 323,996,000 | $0.0936 |
| 2017 | 326,626,000 | $0.0929 |
| 2018 | 329,256,000 | $0.0921 |
| 2019 | 331,884,000 | $0.0914 |
| 2020 | 334,503,000 | $0.0907 |
| 2021 | 337,109,000 | $0.0900 |
| 2022 | 339,698,000 | $0.0893 |
| 2023 | 342,267,000 | $0.0886 |
| 2024 | 344,814,000 | $0.0880 |
| 2025 | 347,335,000 | $0.0873 |
| 2026 | 349,826,000 | $0.0867 |
| 2027 | 352,281,000 | $0.0861 |
| 2028 | 354,698,000 | $0.0855 |
| 2029 | 357,073,000 | $0.0849 |
| 2030 | 359,402,000 | $0.0844 |
| 2031 | 361,685,000 | $0.0839 |
| 2032 | 363,920,000 | $0.0834 |
| 2033 | 366,106,000 | $0.0829 |
| 2034 | 368,246,000 | $0.0824 |
| 2035 | 370,338,000 | $0.0819 |
| 2036 | 372,390,000 | $0.0815 |
| 2037 | 374,401,000 | $0.0810 |
| 2038 | 376,375,000 | $0.0806 |
| 2039 | 378,313,000 | $0.0802 |
| 2040 | 380,219,000 | $0.0798 |
| 2041 | 382,096,000 | $0.0794 |
| 2042 | 383,949,000 | $0.0790 |
| 2043 | 385,779,000 | $0.0786 |
| 2044 | 387,593,000 | $0.0783 |
| 2045 | 389,394,000 | $0.0779 |
Conclusion: This idea of spreading out the Powerball winnings between everyone in the US is stupid. Just give me your Powerball tickets instead.
Update 1: On a whim, I called up my state’s lottery office; they confirmed that there’s no upper limit to the number of people that can split a jackpot.